Oct 31, 2011

Brazil: Average Real Salary

The average real salary in Brazil in August was BRL 1,598.98, with a slight decrease compared with the previous month. However, as we see in the graph, the sequence of real wage gains stopped, showing that the economy activity growth is decelerating.

Source: IBGE

Oct 30, 2011

Impact of International Prices on Brazilian Trade Balance

Veja versão em português aqui.

Impact of International Prices on Brazilian Trade Balance.


The value of Brazilian exports have risen significantly in recent years, reaching almost $ 250 billion in 2011 (over 12 months through September 2011), an increase of 87% compared with the same period of 2006 (See the main commodities exported by Brazil in http://migre.me/61v9b). Imports also grew strongly during the same period, with increase of 150%.


This article have a purpouse to present, in the case of exports, that rising prices explains most of the increase in revenue, and in the case of imports, the increase in volume is responsible for its growth. This study is partly based on working paper done by the Central Bank of Brazil, available in http://migre.me/61tXB.


To carry out this study, we used data from the Ministry of Development of Brazil (MD) available at aliceweb2.mdic.gov.br. We used the chapters of the NCM - Mercosul Common Nomenclature, which divides the goods exported and imported in 97 different categories. The MD discloses, for these 97 categories, the value traded in U.S. dollars and volume in kilograms. The average price for each category was calculated simply by the ratio financial value to the volume.


As time basis for this study, we are considering as "year" the accumulated period of 12 months ending in September, as the latest available is September 2011, and this author found it interesting to use the data on an annual basis. So when we speak  “2006”, we are referring to the period between October 2005 and September 2006, and so on.


We estimated the impact of international prices of exports in the years 2007 to 2011. For this, we fixed the volume exported in 2006. For example, to know the impact of prices on the exports of 2007, we kept the volume of 2006 with 2007 prices, and so on, until the year 2011, ever with  the volume of 2006 fixed. The impact of the rise in volume on exports or imports value was calculated on the difference between the effective value of exports or imports of 2011 and the estimated value with constant volumes. The results are presented in Chart I and in the following comments:


Chart I


Source: Ministry of Development of Brazil
Elaboration: the author


In 2006, the financial value of exports reached USD 132.6 billion. In 2007 and 2008, the increase in international prices was responsible for the increase of 12.9 billion and 38.9 billion in exports, respectively. In 2009, a fall in international prices reduced export revenues in USD 13.8 billion. In 2010 and 2011, with the return of global growth, prices rose again, and the impact on revenue was 17.6 billion and 42.5 billion in these years. The increase in volume represented only USD 16.3 billion in aditional value to exports between 2006 and 2011.


Regarding imports, the effect is the opposite. The volume of imports rose from USD 86.2 billion to 216.5 billion between 2006 and 2011, mainly explained by the increase in volume: USD 95 billion, and to a lesser extent, higher prices: $ 35 billion. Chart II shows the impact of international prices in expenditures on imports between 2006 and 2011.


Chart II

Source: Ministry of Development of Brazil
Elaboration: the author


This result shows some worrying results. Brazil is increasing the physical volume of imports but not exports. The increase in imports have been financed by an increase in prices of exported products, and not by an economic dynamism that could increase competitiveness and increase the volume exported. Thus, the Brazilian trade balance today is very dependent on the dynamics of international prices, which may be a risk to the balance of payments if there is a reversal of this trend in commodity prices.

Oct 29, 2011

Brazil :Delinquency

The delinquency rate on credit operations in Brazil reached 3.5% in September, and is with a tendency to high slightly after the fall recorded during the year 2010. The chart below shows the delinquency rates in credit operations in Brazil.

Source: Central Bank of Brazil

Oct 28, 2011

Investment in Brazilian Stocks by Foreign Investors

Foreign investment in Brazilian stocks amounted to USD 408 million in September and $ 23.5 billion in the last 12 months. The recent trend of foreign investments in stocks are in the chart below.

Source: Central Bank of Brazil

Oct 27, 2011

Brazil: Unemployment Rate

The unemployment rate in Brazil in August was 6%, maintaining the same level of the previous month. Although this is the lowest historical rate for this month, August is a month when the rate falls. These data, as we see in the chart below, show that there is an ongoing slowdown in activity level in the Brazilian economy.

Source: IBGE

Oct 26, 2011

Brazil: Credit Operations Growth

Today, the data on credit in Brazil were relesead. The total volume of credit on financial system was approximately USD 1 trillion, equivalent to a 48.4% of GDP in September, up 19.5% compared to September 2010. The chart below shows the relationship between credit volume and GDP for the Brazilian economy.


Source: Central Bank of Brazil

Oct 25, 2011

Brazil: Current Account in September 2011

The Central Bank announced today the results of the external sector. The current account had a deficit of USD 2.2 billion in September, USD 36 billion this year and USD 48 billion over the past 12 months, equivalent to 2.05% of GDP.
The monthly data for 2011 are in the chart below.


Source: Central Bank of Brazil


Oct 24, 2011

Brazil: Fertilizers Imports

Brazil is one of the largest producers of food, and also one of the largest importers of fertilizers. Over the past 12 months, the country imported nearly 20 million tons, and the tendency is of growth, as shown in Graph below.


Oct 23, 2011

Brazil: Capacity Utilization

The use of installed capacity in Brazilian industry reached 82.2% in August. The chart below shows the evolution of capacity utilization.

Source: CNI


Oct 22, 2011

Brazil: Gross and Net Debt of Public Sector

The gross debt of the public sector reached 56.1% of GDP in August. The central government has domestic credits of 25.9% of GDP, which are mainly credits with official banks as BNDES,  assets available in the Central Bank and investment funds. Net debt is 39.2% of GDP. The chart below shows the composition of net debt of the Brazilian public sector.


Source: Central Bank of Brazil

Oct 21, 2011

Brazil: Net Debt Evolution and Conditioning Factors

In 2011 up to August, the net public debt to GDP fell from 40.2% to 39.2%. The contribution of of public sector borrowing requirements was negative, with the payment of interest exceeding the primary surplus in 1.7%. On the other hand, the effect of GDP growth had an impact of 2.8% reduction in net debt to GDP. The chart below ilustrates the conditioning factors of net debt evolution.

Source: Central Bank of Brazil


Oct 20, 2011

Brazil: Securities Debt Market by Indexing Factor

The gross debt of the consolidated public sector in lAugust was BRL 2.2 trillion, or 56.1% of GDP. The federal government's securities debt reached BRL 1.6 tri. The debt securities composition is below, by indexing factor:


Source: Central Bank of Brazil

Oct 19, 2011

Brazil: Interest Rate (Selic)

The Central Bank of Brazil announced today the basic interest rate (Selic). The Selic rate decreased from 12.0 % to 11.5%, the second consecutive drop. In the statement, the Central Bank reported that a moderate adjustment in the level of the base rate is consistent with the scenario of convergence of inflation to the target in 2012. Despite this fall, interest rates in Brazil are still among the highest in the world. The chart below shows the evolution of the Selic rate in 2011.


Source: Central Bank of Brazil


Oct 18, 2011

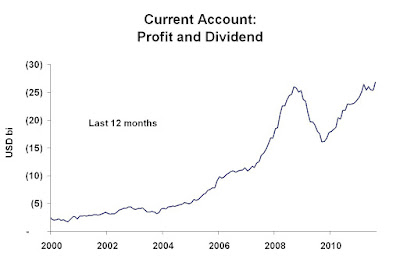
Brazil: Current Account - Profit and Dividends

The net flow of profits and dividends tranfers from foreign companies installed in Brazil reached U.S. $ 3.6 billion in August. Over the past 12 months, the transfer was $ 27 billion. The following chart shows the recent evolution of the Brazilian transfer of profits and dividends from foreign companies.

Source: Central Bank of Brazil

Oct 17, 2011

Brazil: Automotive Production

The automotive production, according to Anfavea, reached 261,000 units in September. This value is 19.7% and 5.8% lower than August and September 2010 respectivaly. In 2011, total production reached 2.6 million vehicles up to September. In 2010, total production was 3.4 million of vehicles.


Source: Anfavea

Oct 16, 2011

Brasil: Labor Market in Construction Sector

The increase in the minimum wage and the labor tight market have been pressing the cost of construction in recent years. Over the past 12 months, the cost of labor rose 10% against 7.3% inflation. The costs of labor in the construction industry have been systematically rising more than inflation, as we can see from the chart below.

Source: FGV and IBGE

Oct 15, 2011

Is There Really a Bubble in Real Estate in Brazil ?


Versão em português: http://brazilfocus.blogspot.com/2011/10/existe-realmente-risco-de-uma-bolha-no.html


When we observe the rapid growth in the value of property in Sao Paulo and remember the real estate crisis in the U.S. in 2008, we can easily be led to believe that there is a bubble in the Brazilian housing market, and this could lead to a crisis in the banking sector, as well as occurred in the U.S. In this article, I would put my personal experience as a resident of São Paulo, trying to detail my observations, in order to understand whether it makes sense to think in bubble.


There is no comprehensive statistical data on the increased prices of property in Brazil. There are some localized content, such as FIPE, which calculates the change in price for some cities. According to FIPE, the increase in property prices between late 2007 and September 2011 was 113% in São Paulo and 150% in Rio de Janeiro. (Source: http://migre.me/5VKLP). In my personal experience, I bought my apartment in late 2007 for BRL 3,500 per square meter and my neighbor want to sell his by BRL 9,000 per square meter, ie, with variation above the increase calculated by Fipe in the same period. (USD 1 = BRL 1,78)


I try to list the main reasons to cause the increase in property prices:


1. The city of Sao Paulo has a chronic problem of traffic and an unfavorable geography. Jobs are concentrated in a few districts, and most people spend a considerable time in locomotion, because urban transport is poor, and the extension of subway lines is not appropriate for the size of the city. For example, I live 6 km from the office where I work, and I take on average 30 minutes to arrive by car. It is normal to a citizen of Sao Paulo takes in traffic 2-3 hours a day on the way to go and back from work, and even more if uses public transportation. Thus, living close to work becomes something very valuable, and much of the population is willing to pay more for it.


2. World economic growth between 2003 and 2007 favored particularly Brazil, which has seen commodity prices soar (see post on http://migre.me/5VJOT) and also made the country to receive a new investment boom. Sao Paulo is the economic and financial center of Brazil, where the staff of most large companies are installed and also concentrates the services of stock exchanges and investment banks. Thus, the country's economic growth made Sao Paulo attract a larger number of executives and professionals with high incomes, and consequently, with  higher demand mainly by the high-level houses in the most valued places


3. In Brazil, the property is still seen as a value reserve. The memory the period of hyperinflation in Brazil (ended in 1994) still persists, when people bought property to protect themselves from inflation. Until today, I know people who have put their resources in real estate, although the return in government securities has a higher yield than the return on rental property.


4. There is a lack of good land in some districts. This makes the builders have to purchase homes and / or property to tear down and build buildings. This has an impact on construction costs and the final value of the property.


5. Being a property owner has always been considered a synonymous of security. The idea of ​​own a property has been seen considered a "dream." I remember that in my childhood, pay rent was seen as derogatory by others. This means that the decision to purchase the "home" has an emotional component, not just rational economic.

6. The cost of labor for construction have risen sharply. The cost of labor rose 40% and the other construction costs have risen 25% between December 2007 and September 2011 compared to an inflation of 23% over the same period. (Sources: FGV and IBGE)


7. Change in law for rental properties. By 2008, the punishment for non-payment of rent was very mild: the removal of a tenant deliquient  demanded a judicial process for over 6 months to 1 year. With the change in law, the process became easier, providing more security for those who bought a property for the purpose of renting


This list of reasons for the high prices of real estate in São Paulo should not modify the short term, and therefore, house prices should remain high. But if this analysis is wrong, and indeed housing prices fall, what are the consequences? Before entering the answer, we understand how the real estate loans works in Brazil


1. Banks, in general, do not lend 100% of the value of the property. In general, they finance between 70% and 80% of the total, and the borrower must pay in cash the difference, but entire property is given as collateral. This means that the price have to drops more than 30% for the borrower have an incentive for not paying the loan. This significantly reduces the risk of deliquency.

2. When buying a property in the plant in Sao Paulo, the buyer makes payments to the builder during the construction phase, and then ask a loan of the remainder with a bank in the delivery of the property. We return to the same situation: the bank finances only part of the property, but has the entire property  given as collateral. And if there is a crisis, banks are likely to be more selective in granting credit, and therefore, the burden will be greater with the builder.

3. The volume of mortgage lending in Brazil is very small compared with most countries. In 2011, mortgage credit to GDP reached 6%, and represented 12.5% ​​of the total loan portfolio of banks. This means that, in the event that there is a total default, banks will bear a loss affordeable.


My conclusion is that, despite the increase in property prices, we cannot say that there is a bubble, but if, for any reason, there is a fall in house prices, there is no risk to the banking sector, and the big losers will be those who bought houses at high prices, and the builders who are not with reasonable costs or strong cash. I can´t see a crisis on the horizon with higher dimensions as the U.S. in 2008 or Japan in 80´s.


Oct 14, 2011

Brazil: Terms of Trade

The terms of trade index of Brazilian foreign trade is at the highest level in the last 30 years, due mainly to higher commodity prices. The index rose 35% in the last 10 years and and 81% in the last 30 years (data of Aug.2011).


Source: Funcex

Oct 13, 2011

Brazil: Activity Level

The Central Bank of Brazil announced today the IBC-Br. The IBC-R is an indicator of economic activity, calculated from figures of the industry, services and agriculture, and serves as a proxy for GDP growth in Brazil. In August, the IBC-br fell 0.53% compared to July, and rose 2.02% compared to August last year. These data show that economic activity in Brazil is in a slow down process. The chart below shows the recent evolution of the IBC-Br.


Source: Central Bank of Brazil

Oct 12, 2011

Brazil: Retail Sales


The retail sales volume index grew 6.2% in July, compared to same month in the previous year, according to IBGE. In relation to July, it fell by 0.4%. The retail nominal revenue rose 12.3% compared to same month in the previous year and 0.3% over the month before. The following chart shows the evolution of the volume of sales.


Source: IBGE


Items with the largest growth, compared to same month in the previous year, were (i) furniture and domestic appliances and (ii) office, computer and communication equipment, with growth of 16.9% and 25.3% respectively. The table below shows the main items that compose the volume index of retail sales.


Source: IBGE

Oct 11, 2011

Brazil: Employed People

IBGE
(Brazilian Institute of Geography and Statistics) performs your search unemployment in six metropolitan regions in Brazil. These regions, in August, had a total population above 10 years of 41.9 million people and 22.6 million held a paid job last week, equivalent to 53.9% of the total. The following chart shows the relationship between the total employed population and economically active population since 2003.


Source: IBGE

Oct 10, 2011

Brazilian Direct Investment

Brazilian investors returned USD 10.8 billion in direct investments made ​​in other countries in 2011 (until August). In 2011, Brazilian investments abroad reached 11.5 billion, as we can see from the chart below.

2011: Up to August
Source: Central Bank of Brazil


Oct 9, 2011

Brazil: Interest Rate on Personal Loans

The interest rate charged for personal loans in Brazil was 49.6% per annum in August 2011 and 41.96% in the same month last year. Despite the downward trend in recent years and, the rates are still considered very high, among the largest in the world. The recent evolution of interest rate on personal loans is showed in the graphic below.


Source: Central Bank of Brazil


Oct 8, 2011

Brazil: Travel Account

In
September, foreign spending on travel in Brazil was $ USD 605 million. On the other hand, Brazilians traveling abroad spent USD 1.9 billion, generating a negative deficit in the travel account for 1.3 billion. Over the past 12 months, the expenses of Brazilians abroad reached USD 20.8 billion against USD 6.5 billion of spent by foreigners in Brazil. The balance of travel account in the last 12 months is showed in the chart below.

Source: Central Bank of Brazil

Oct 7, 2011

Brazil: Inflation

The consumer price Index, measured by the  “IPCA index, reached 0.53% in September and accumulated 7.31% in the last 12 months. The item "Food and Beverage," which weighs 23% in the index, rose 0.64% in September, and 9.93% in the last 12 months. The chart below shows the recent evolution of inflation in Brazil.

Source: IBGE

Oct 6, 2011

Industrial Production

In August 2011, industrial production showed negative growth of 0.2% compared to the previous month. In relation to August 2010, industrial production grew 1.8%, and in the first eight months, the  growth is 1.4%. The graphic below shows the recent evolution of industrial production in Brazil.


Source: IBGE

Oct 5, 2011

International Reserves

The volume of international reserves reached USD 349 billion on 04 October. This number is the equivalent of 1.6 years of imports, based on the last 12 months. In late 2010, the level of reserves was $ 289 billion, ie, the country has accumulated $ 60 billion in the year. The chart below shows the recent evolution in the volume of international reserves.


Source: Central Bank of Brazil

Oct 4, 2011

Brazil - Exports of Commodities


In September, exports of the eight main groups of commodites accounted for USD 11.7 billion. The main product exported was iron ore, with values ​​of $ 4 billion. The second main product of the exports were soybeans, with USD 2.2 billion in the month. The following chart shows the main commodities exported during the month of September.

Source: http://www.mdic.gov.br/